EMBedded Oscilloscope

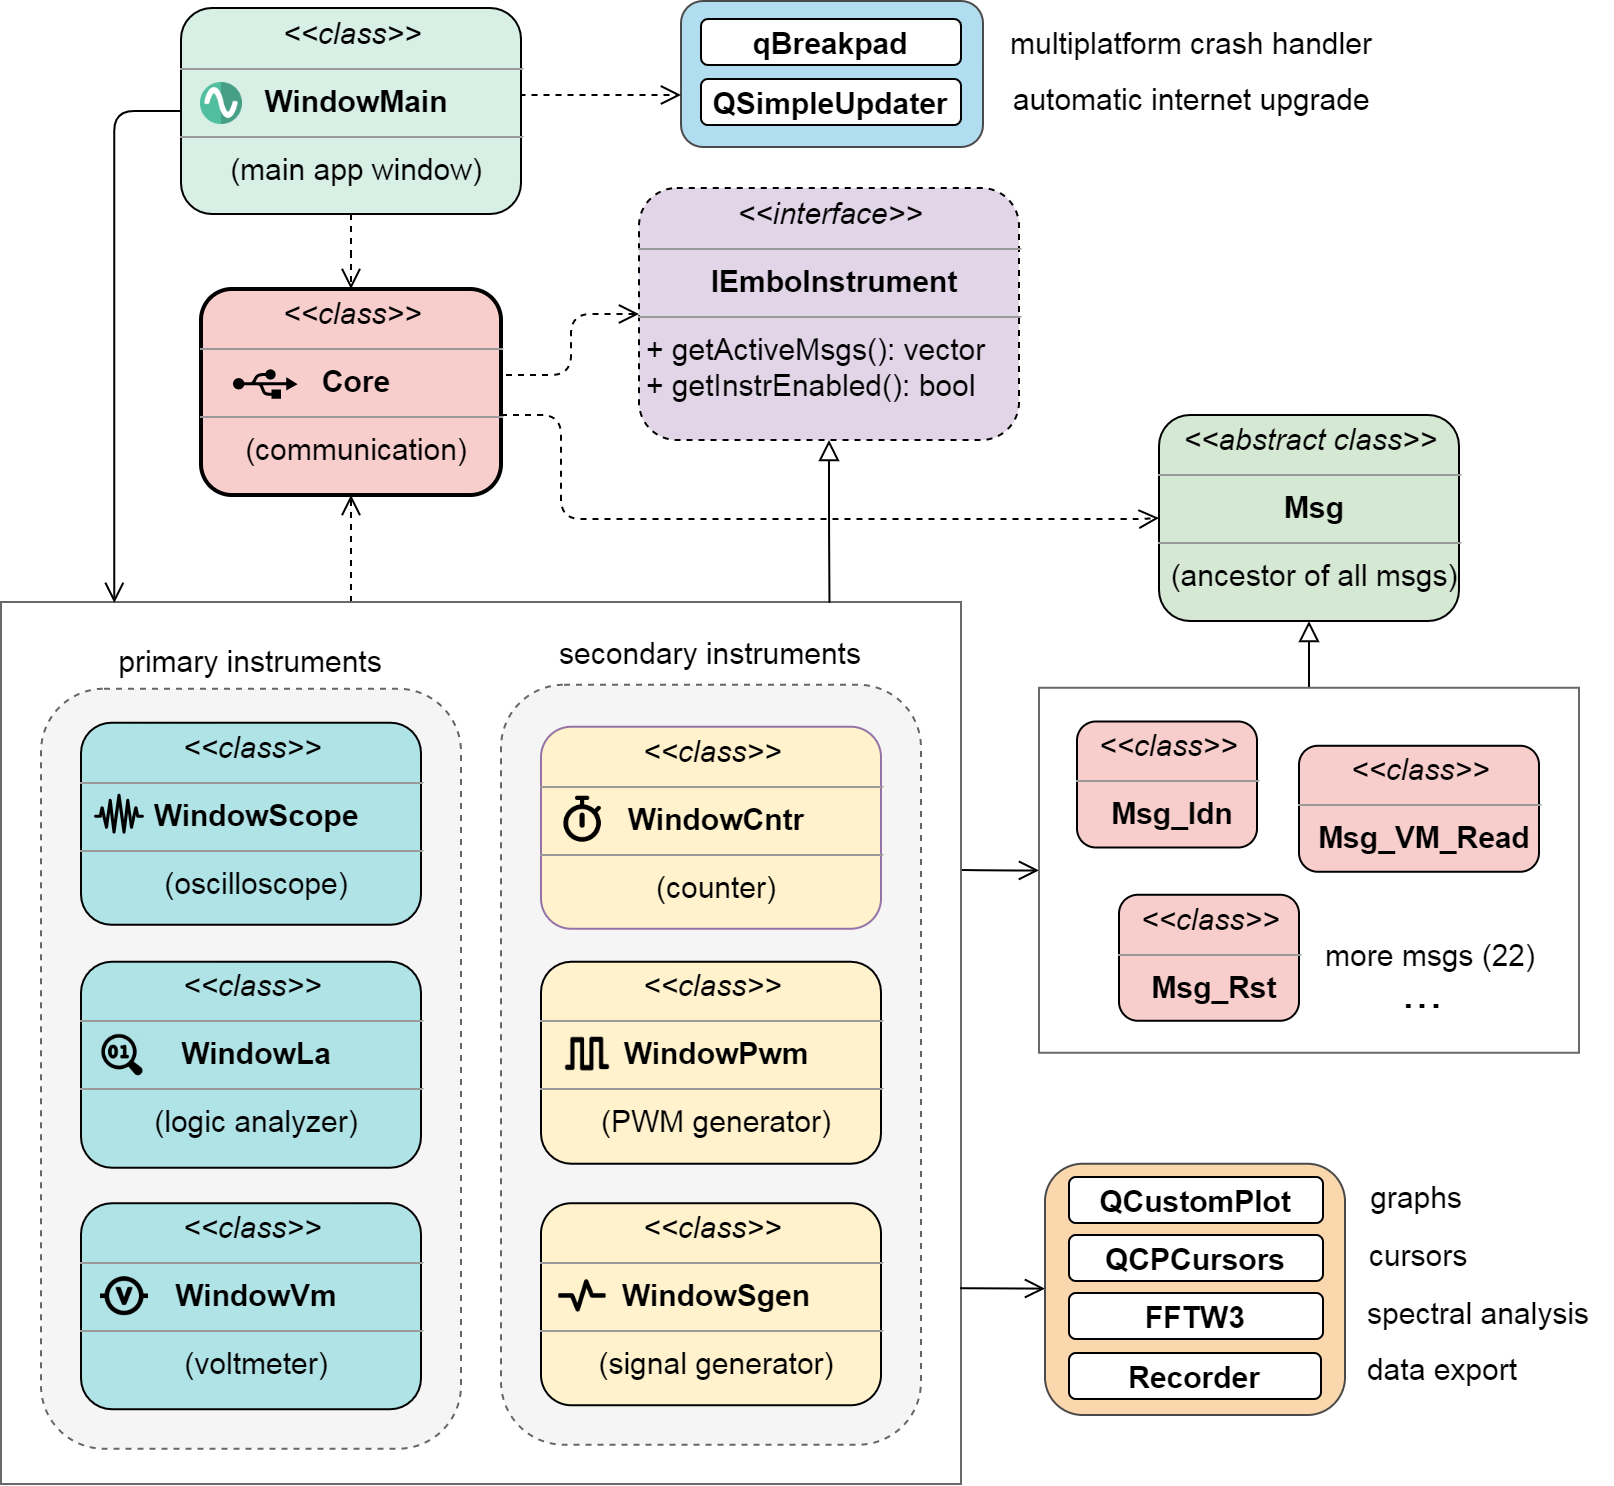
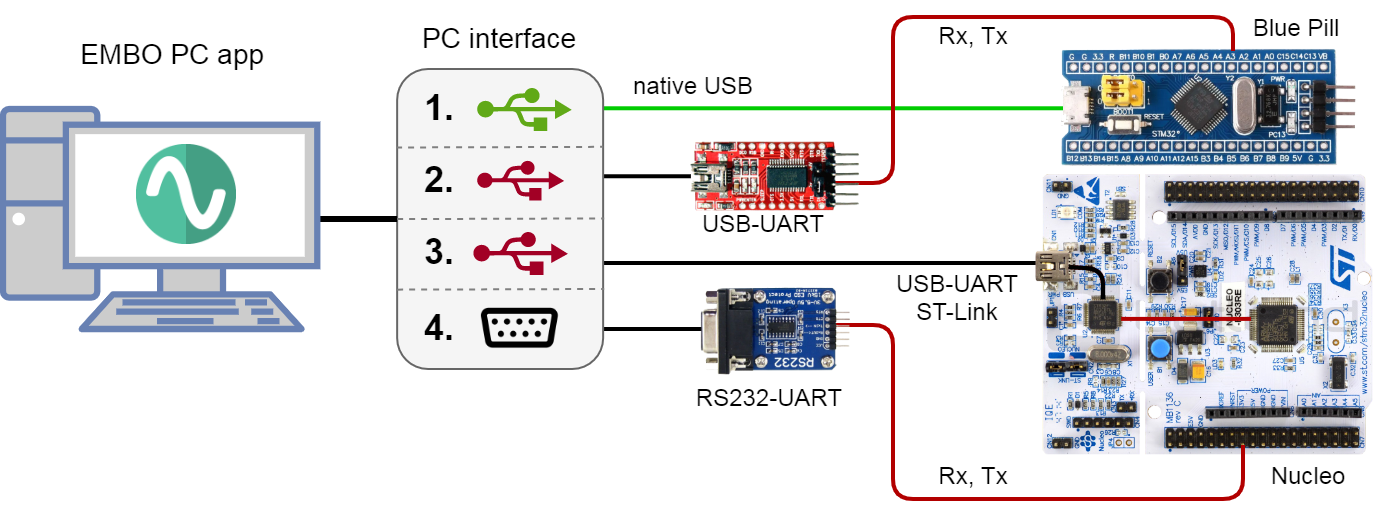
EMBO consists of 3 primary devices (oscilloscope, logic analyzer, voltmeter) and 3 secondary devices (counter, PWM and signal generator). The multiplatform PC application can be run on Windows, Linux and macOS operating systems. Stable firmware is available for STM32 series F1, F3 and L4 in HEX format, other series L0 and G0 are currently supported experimentally. The EMBO oscilloscope is intended to serve as a cheap and accessible tool for all electronics enthusiasts.
This work was created as part of my master thesis at FEE CTU in Prague (Department of Measurement) under the supervision of doc. Fischer and with the help of Ing. Hladík from STMicroelectronics. I would like to thank them for perfect support. Whole EMBO is published under the MIT license.
Supported MCUs:
More yet to come... (L0, G0, G4, F4)
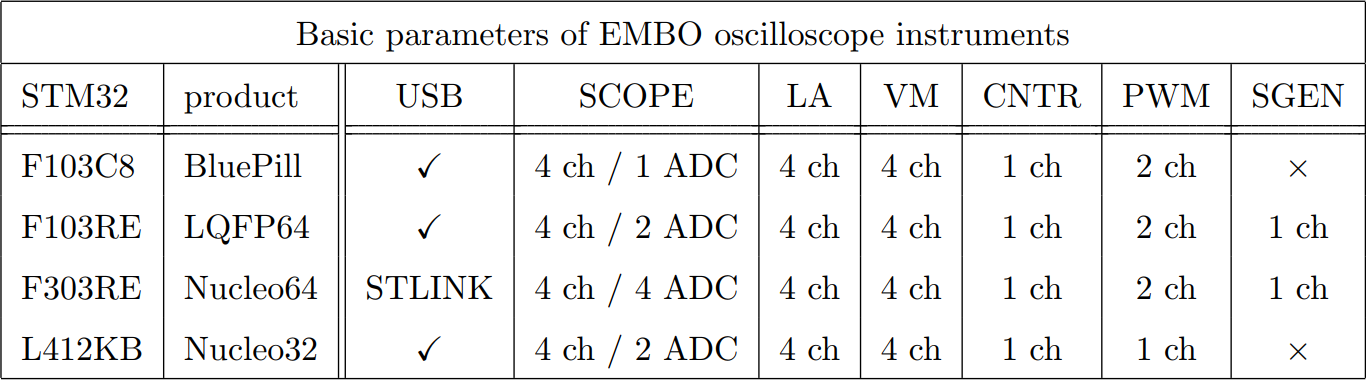
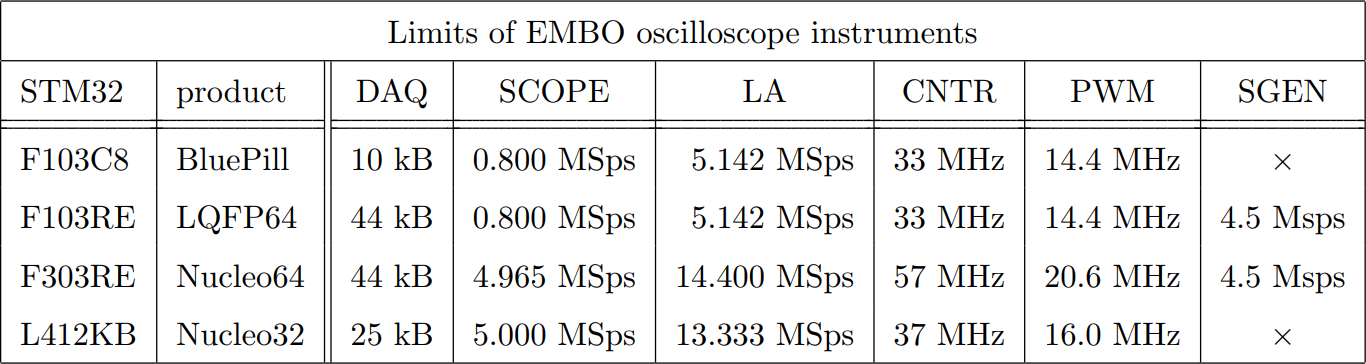
* SCOPE - Oscilloscope, LA - Logic Analyzer, VM - Voltmeter, CNTR - Counter, PWM - PWM Generator, SGEN - Signal Generator, DAQ - total memory for SCOPE or LA
After starting the PC application, the user gets to the main window with the selection of individual devices. On the left is a list of available ports (in the case of Windows OS these are COM ports, in the case of a UNIX-like system these are tty ports. The user selects the port and connects to the oscilloscope. The three panels on the right are displayed. about the microcontroller and firmware, in the middle panel there are primary devices and their parameters and in the bottom panel secondary devices are available.
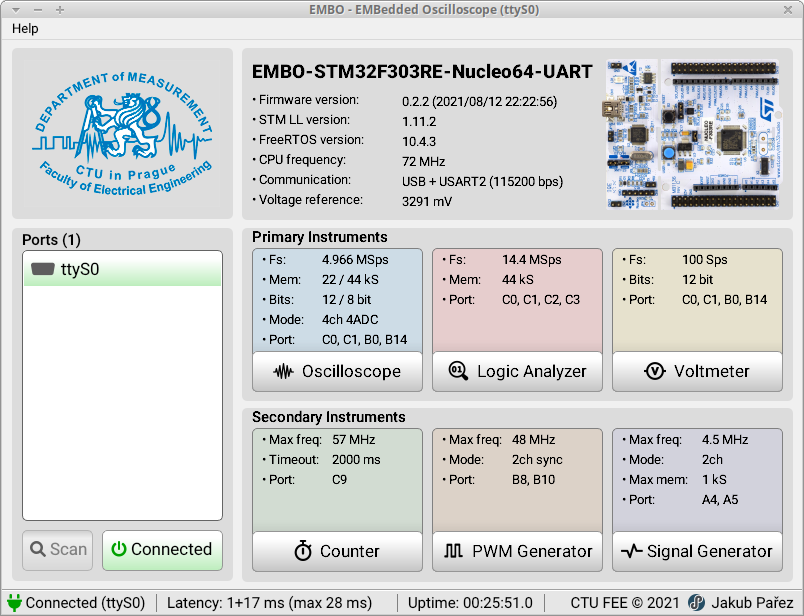
The bottom bar (status bar) contains information about the current session, which is ideally updated with a period of 10 ms. Latency indicates the response time of the oscilloscope and Uptime indicates the time since power-up. If the communication is busy (the oscilloscope sends a lot of data), the latency can increase up to hundreds of ms when using UART (ST-LINK).
Description of device parameters:
The oscilloscope is a key device of the whole system. The oscilloscope window is divided into two main blocks. In the left block there is an interactive graph, under which lie measuring elements and cursor controls. The most important controls are concentrated in the right blocks. Auxiliary and additional functions are controlled from the top menu. The lower part of the screen is set aside for the status bar.
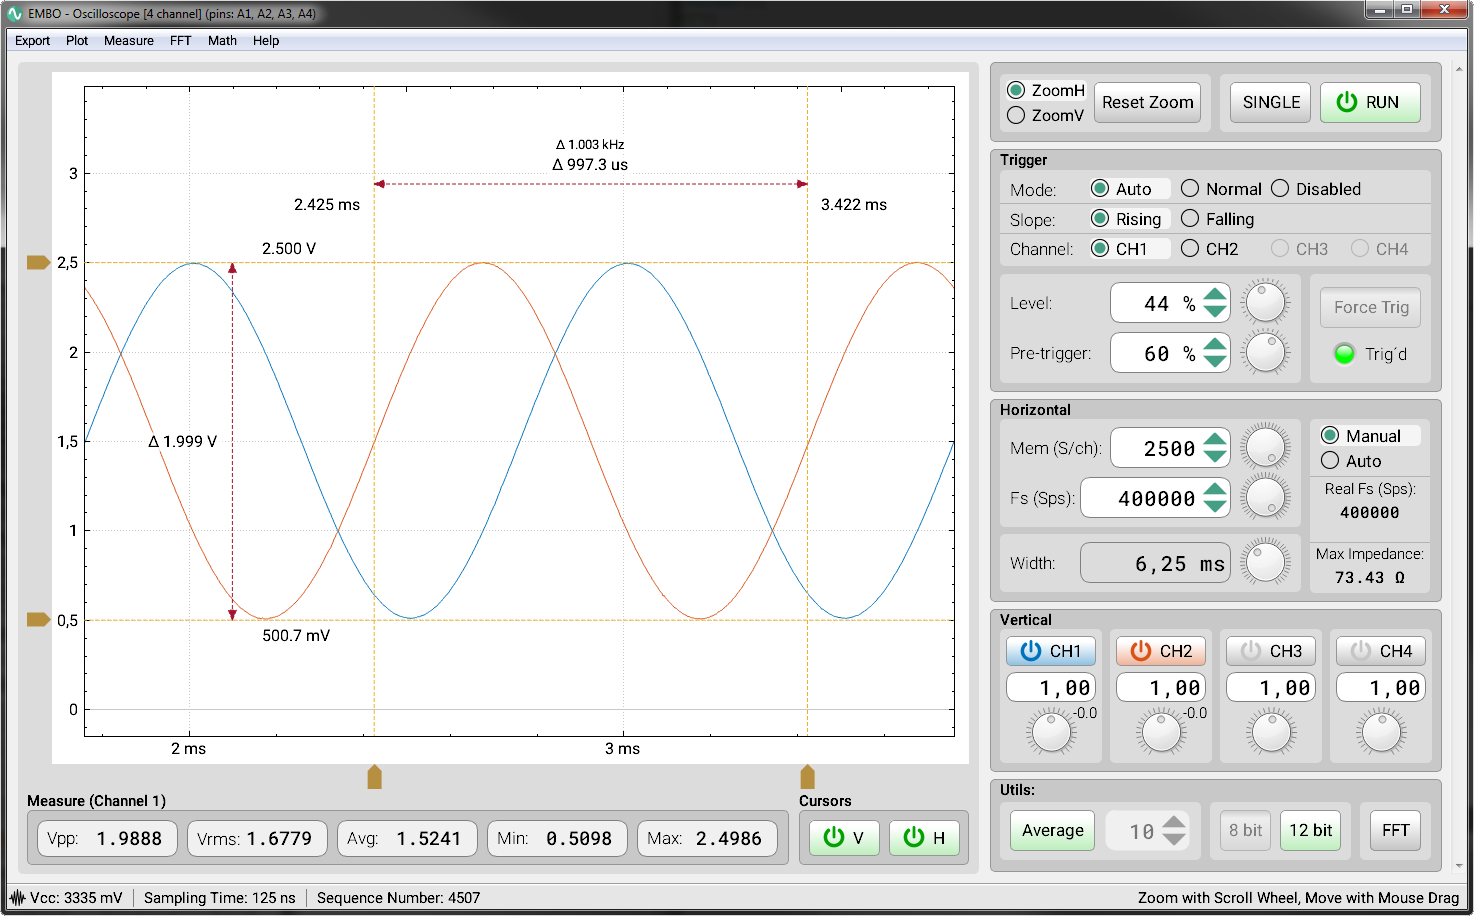
Description of control panels:
As with most oscilloscopes, EMBO has 3 main modes: Run, Stop and Single. The implementation of these modes is inspired by desktop digital oscilloscopes (Agilent, Tektronix). Run mode is the primary mode with continuous data acquisition. Stop mode is used to stop acquisition and signal analysis. The special Single mode is used to capture a single event. Furthermore, in this panel, the user has the option to reset the zoom or the entire device.
The trigger setting is also inspired by desktop devices. The default is always Auto mode, which combines the functionality of Normal mode with a timeout that allows you to see the signal in all cases. There is also an adjustable Slope, Channel, Level and pre-trigger. In Normal and Single mode, the user has the option to force a trigger, which serves as a quick preview. The indicator LED named Trig´d lights up green if the trigger was successful (flashes with each new message).
Horizontal parameters can be set in 2 modes. In manual mode, the user sets the sampling frequency (Fs) and memory depth per channel (Mem). In automatic mode, these 2 parameters are optimized based on the total length of the displayed signal (Width). This approach was chosen because the classic grid and settings (second / division) do not make sense here, because the graph is interactive and the user can freely zoom and move with it. Below are 2 important pieces of information. Real sampling frequency (Real Fs) with an accuracy of 6 orders of magnitude is required for sampling at the equivalent time and subsequent frequency recalculation. The maximum permissible impedance of the source signal is described in detail in the chapter.
Vertical adjustment allows you to turn on individual channels, adjust their gain and offset.
Averaging is suitable for smoothing the interfered signal. Optional 8-bit mode speeds up data transfer at the expense of reduced resolution, and FFT turns on spectral analysis mode. Cursors are used to measure the signal in both axes and the measured parameters (Measure) represent the basic information about the signal.
Description of the top menu:
The logic analyzer provides additional oscilloscope functionality for fast digital signals. Like the oscilloscope, the instrument is divided into two main blocks. In the left block there is an interactive graph that dynamically displays the appropriate number of channels, unlike the oscilloscope but below it. In the right blocks are the main controls coming from the oscilloscope. Additional functions are controlled again from the top menu. The lower part of the screen is set aside for the status bar.
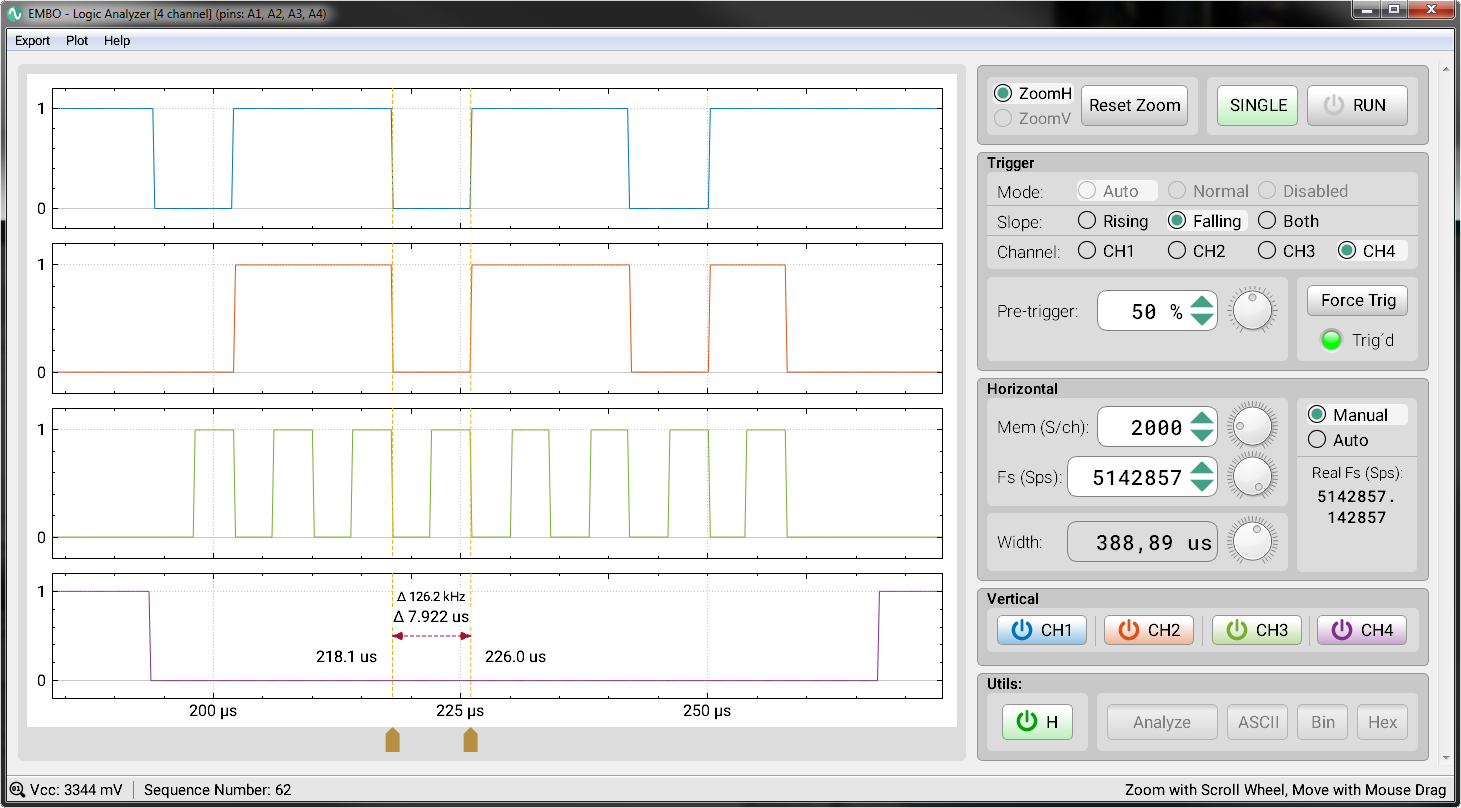
Most controls share the same functionality and design with the oscilloscope. The difference is with the trigger, where the trigger level is missing, on the contrary, the possibility to trigger on both edges (Both) has been added. Furthermore, the vertical gain and offset are missing because they do not make sense for the logic analyzer. Similarly, averaging mode, bit resolution, and FFT are also missing.
Description of control panels:
The voltmeter is the last primary instrument of the EMBO oscilloscope. Its window is again divided into two main blocks. In the left block there is an interactive graph, under which the measured parameters and the cursor driver are displayed. In the right block there are 4 channel panels below them and below them is the main control panel (Settings).
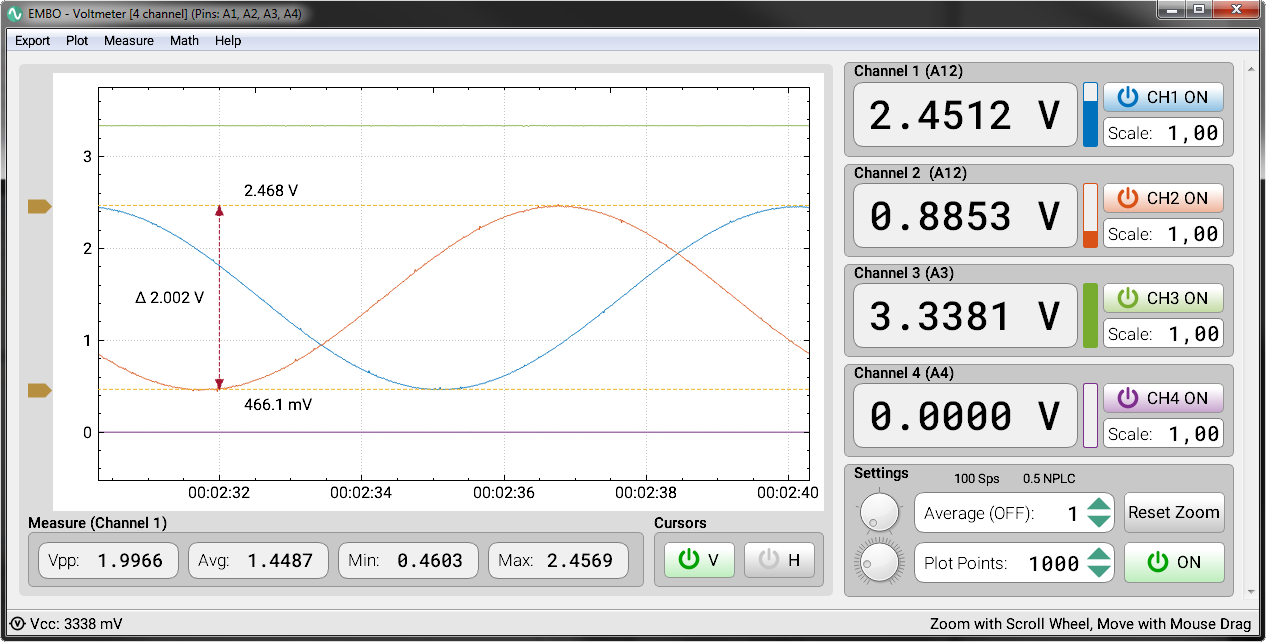
Description of adjustable parameters:
The sampling frequency is fixed at 100 Sps. This is twice the frequency of the mains voltage. When averaging mode is off, the NPLC (Number of Power Line Cycles) value is 0.5. If we increase this value (by increasing the Average value), we will significantly suppress the induced 50 Hz noise. The higher the value of Average, resp. NPLC, the slower the voltmeter measures and the more noise is suppressed. The Average mode therefore increases the accuracy of constant signal measurements.
In addition to the main settings, you can use additional options from the top menu, which is similar to the oscilloscope. In addition to standard settings, such as interpolation or setting of measured parameters, for example, continuous recording to a file (CSV or TXT) can be switched on. The recorded signal will have a sampling frequency of 100 Sps.
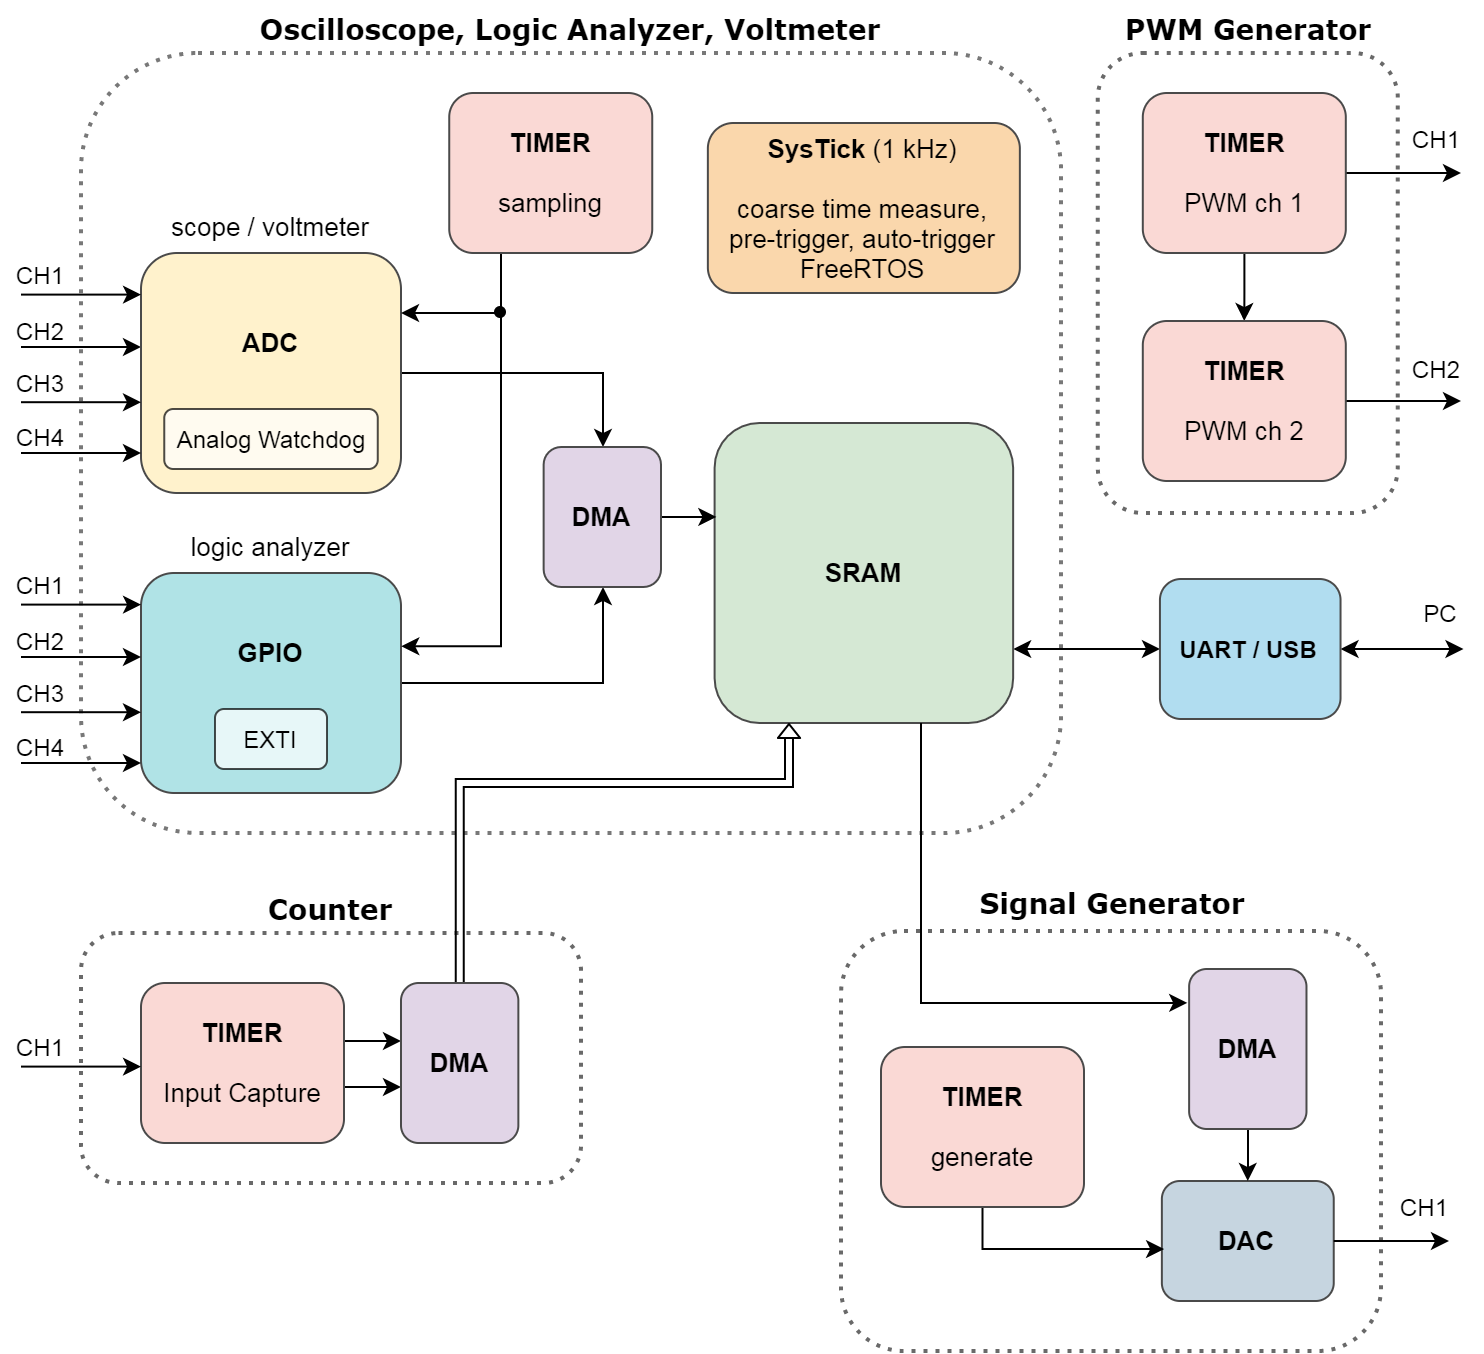
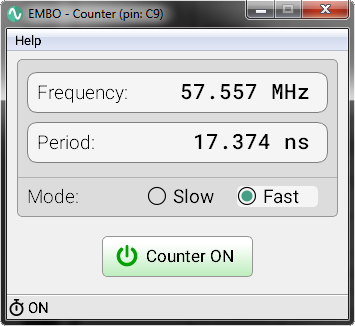
The counter is a simple secondary device that can be operated in parallel with other devices. Slow mode (for signals up to approx. 1 MHz) and Fast mode (for signals from approx. 1 MHz) can be set. For slow signals, the measurement takes longer. If no signal is detected within 2 seconds, a timeout occurs. When used with an oscilloscope or logic analyzer at the maximum sampling frequency, DMA overload and sample dropping may occur.
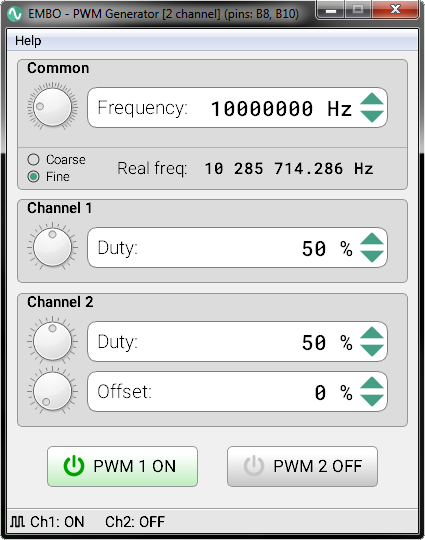
The PWM signal generator exists with either 1 or 2 channels. In the case of 2 channels, it is a synchronous generator that can be used to control motors or to simulate signals from a quadrature encoder. The frequency is set the same for both channels. You can also set the shift separately for the channel and the offset of the second channel. Again, it should be emphasized that at high values of the sampling frequency of the oscilloscope, the measured signal may be adversely affected.
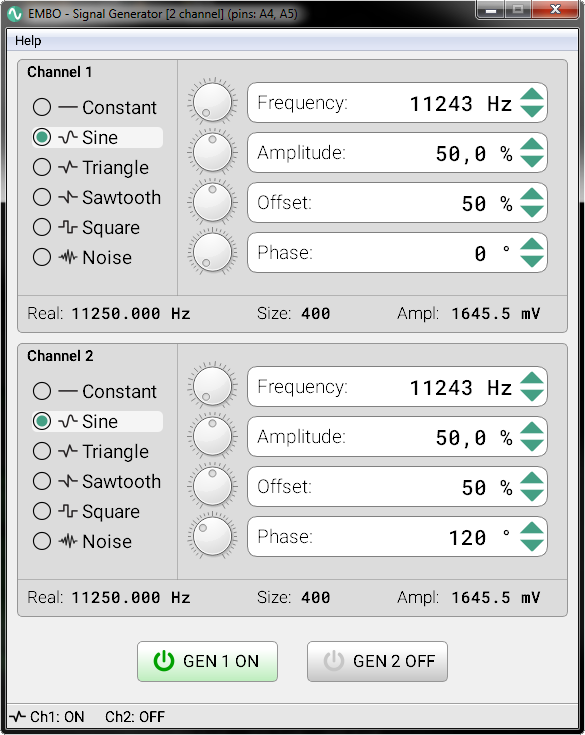
The signal generator is a secondary optional device that uses a 12-bit DAC. It is only available for those microcontrollers that have a DAC, such as the F303RE. The user can set the frequency, amplitude and offset. At high frequencies, the size of the output buffer is dynamically reduced, ie the samples per period (Size), so that the DAC manages to generate. The real frequency of the generated signal and the magnitude of the amplitude in millivolts are also shown. In Constant mode, the generator acts as a voltage source.
Operation modes: